

The Technology Acceptance Model explains why people accept or reject digital tools. Developed from TAM theory, it sits at the heart of technology acceptance and information systems adoption. The model views users as decision-makers shaped by beliefs, experience, and context. This idea dominates modern IS management research in the United States.
However, TAM is more than theory. It connects user acceptance of technology with real information system use and system utilisation. By grounding adoption in psychology, TAM helps firms predict technology utilisation before rollout. That foresight saves money, reduces resistance, and improves outcomes.
Core Concepts and Key Components of TAM
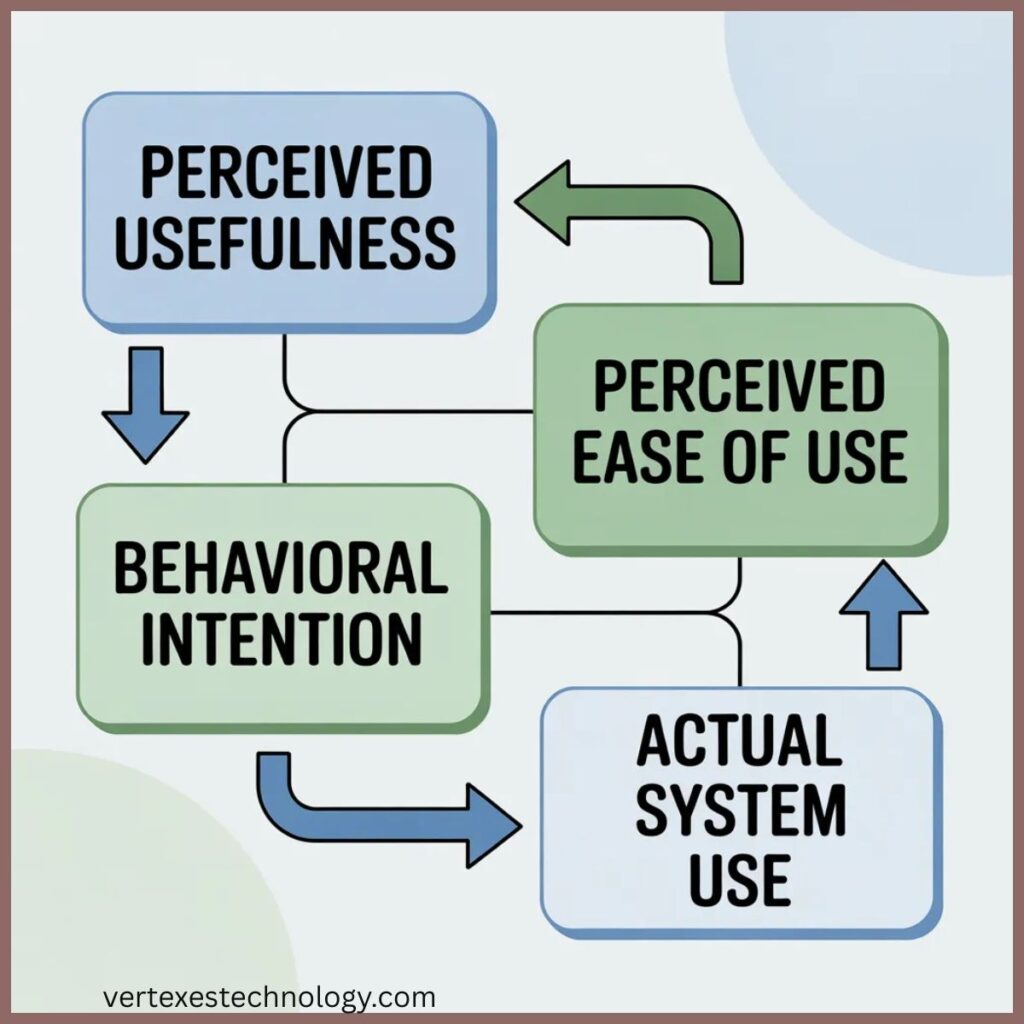
At its core, the Technology Acceptance Model rests on beliefs and intent. Perceived usefulness reflects whether a system boosts performance. Perceived ease of use captures effort expectations. Together, they shape attitude toward use, influence behavioural intention, and predict actual system use.
From a psychological perspective, these beliefs trigger cognitive responses and an affective response. Users judge outcomes, assess effort, and form technology beliefs. This mirrors classic human behaviour theory and aligns with decision-making behaviour observed across workplaces.
How the Technology Acceptance Model Explains Technology Adoption

The Technology Acceptance Model explains adoption through cause and effect. Beliefs drive intent, and intent drives use. This logic echoes the Theory of Reasoned Action (TRA) and the Theory of Planned Behaviour. TAM simplifies them for acceptance of information technology.
For example, when employees expect strong system performance perception, adoption rises. Higher self-efficacy lowers anxiety. Positive user perception improves outcome judgement. These links help explain adoption gaps seen in technology adoption research.
Extensions of the Technology Acceptance Model
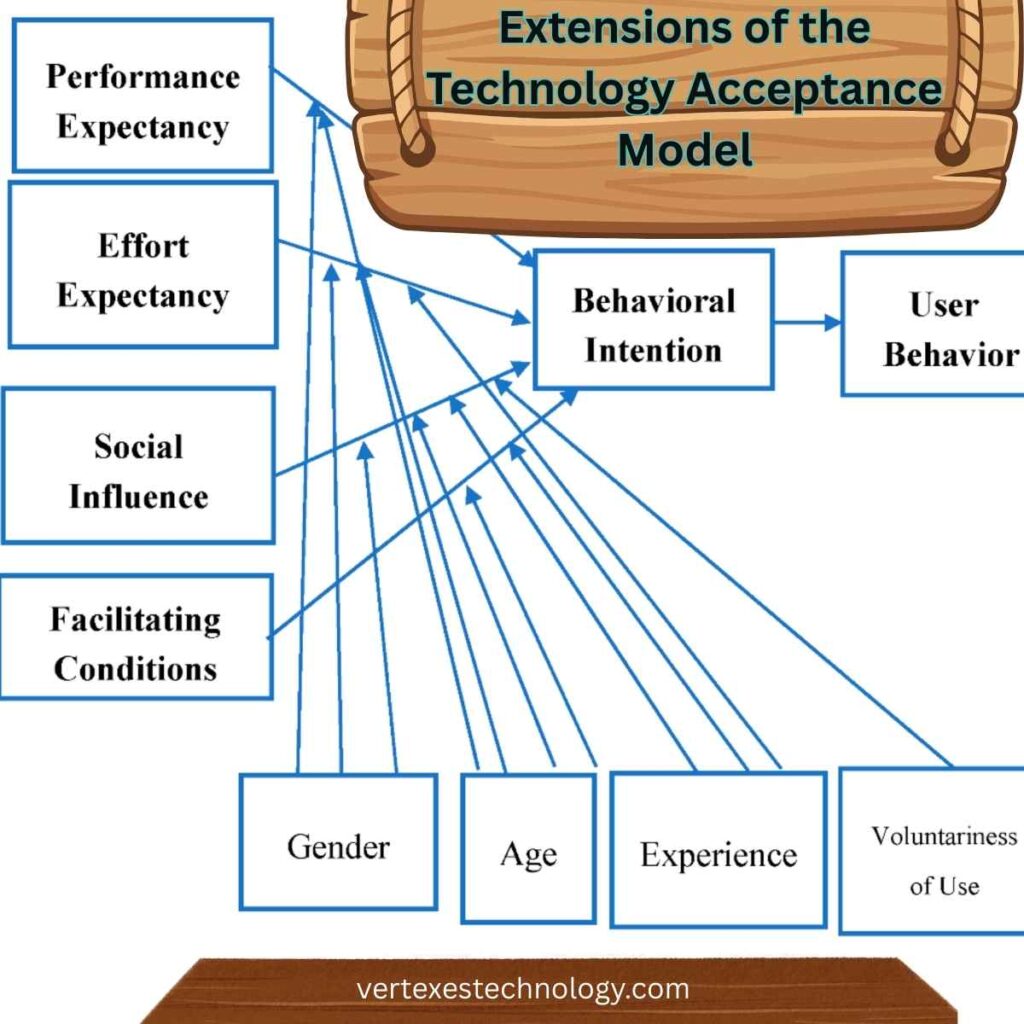
TAM2 expanded the original model by adding social context. Factors like subjective norm, social influence, and image explain workplace pressure. Variables such as job relevance, output quality, and result demonstrability improve prediction accuracy across organisations.
Later, TAM3 deepened understanding of usability. It introduced computer self-efficacy, computer anxiety, and perceived enjoyment. Concepts like objective usability, perception of external control, and computer playfulness clarified user learning over time.
Anchoring and Adjustment in TAM Extensions
Anchoring factors shape first impressions. Adjustment factors refine beliefs after experience. Together, they explain post-implementation behaviour. This structure improved empirical validation, strengthened psychometric properties, and enhanced construct reliability in longitudinal studies.
Applications of TAM in Real-World Contexts
The Technology Acceptance Model thrives in practice. It guides organisational technology adoption across e-learning systems, e-commerce platforms, and mobile commerce. Researchers link TAM to online shopping behaviour, chatbots adoption, and mobile banking acceptance.
Healthcare uses TAM to study telemedicine adoption and healthcare information systems. Governments apply it to e-government systems. Emerging fields explore virtual reality acceptance. Across sectors, TAM predicts system utilisation before heavy investment.
| Sector | Example Application | Adoption Insight |
|---|---|---|
| Education | Learning platforms | Ease drives sustained use |
| Finance | Mobile banking | Trust boosts intention |
| Retail | Online stores | Usefulness predicts loyalty |
Benefits and Strengths of Using the Technology Acceptance Model
The Technology Acceptance Model offers clarity. Its variables explain large variance explained in usage. Studies confirm strong internal validity and external validity. Researchers value its clean measurement scales and self-reported usage consistency.
Managers benefit too. TAM identifies predictors of technology use and determinants of acceptance. It informs system implementation strategies, boosts organisational productivity, and supports pre-implementation strategies grounded in data.
Criticisms, Limitations, and Future of TAM
Despite success, TAM limitations exist. Critics cite theoretical blind spots, model replication criticism, and common method bias. Heavy reliance on intent introduces self-reported intention bias. The model also shows a lack of design focus.
Future work blends TAM with task-technology fit and performance impact. Scholars explore cultural differences in technology acceptance, including individualism vs collectivism and power distance. Cross-context research strengthens the maturity of TAM.
Quote from IS Research
“TAM remains the most resilient framework for explaining technology acceptance across time and context.”
What are common mistakes in TAM analysis?
Common mistakes include relying only on intention data, ignoring context, and misusing measurement scales.
How to calculate TAM in Excel?
TAM is calculated in Excel by averaging survey scores for perceived usefulness, perceived ease of use, and behavioural intention.
What is an example of a TAM analysis?
A TAM analysis may study why employees adopt new software by measuring ease of use, usefulness, and usage intention.
What does TAM mean in technology?
In technology, TAM means Technology Acceptance Model, a framework that explains why users accept or reject systems.
Why is TAM theory so popular?
TAM theory is popular because it is simple, predictive, and works across industries and technologies.
Is UTAUT an extension of TAM?
Yes, UTAUT builds on TAM by adding social influence, facilitating conditions, and performance expectancy.
What are the key components of the TAM?
The key components are perceived usefulness, perceived ease of use, behavioural intention, and actual system use.
What is the TAM framework for technology?
The TAM framework explains how beliefs shape user attitudes, intentions, and real technology usage.
How is TAM calculated?
TAM is measured using validated surveys and statistical analysis like regression or structural equation modeling.
What is TAM vs SOM vs SAM?
TAM is total available market, SAM is serviceable available market, and SOM is serviceable obtainable market.
How much does a TAM typically earn?
TAM itself does not earn money; it estimates the total revenue potential of a market.
Final Thoughts
The Technology Acceptance Model remains essential for information systems management, marketing technology adoption, and education technology acceptance. When paired with organisational interventions and post-implementation evaluation, TAM continues to evolve. Its future lies in smarter integration, not replacement.